Search
As of October, 2016, Embarcadero is offering a free release
of Delphi (Delphi
10.1 Berlin Starter Edition ). There
are a few restrictions, but it is a welcome step toward making
more programmers aware of the joys of Delphi. They do say
"Offer may be withdrawn at any time", so don't delay if you want
to check it out. Please use the
feedback link to let
me know if the link stops working.
Support DFF - Shop
If you shop at Amazon anyway, consider
using this link.
We receive a few cents from each
purchase. Thanks
Support DFF - Donate
If you benefit from the website, in terms of
knowledge, entertainment value, or something otherwise useful,
consider making a donation via PayPal to help defray the
costs. (No PayPal account necessary to donate via credit
card.) Transaction is secure.
Mensa®
Daily Puzzlers
For over 15 years
Mensa Page-A-Day calendars have provided several puzzles a year
for my programming pleasure. Coding "solvers" is most fun,
but many programs also allow user solving, convenient for "fill
in the blanks" type. Below are Amazon links to the
two most recent years.
Mensa®
365 Puzzlers Calendar 2017
Mensa®
365 Puzzlers Calendar 2018

(Hint: If you can
wait, current year calendars are usually on sale in January.)
Contact
Feedback:
Send an
e-mail with your comments about this program (or anything else).
|
| |
Problem Description
Updates: (It's not so simple anymore!)
August, 2002 - Version 1:
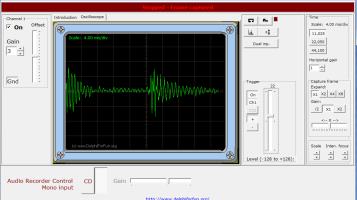
Here's an oscilloscope program that uses your sound
card for input. My hope is that it encourages a few future scientists
(and/or
Delphi programmers) to experiment -- and have some fun in the process.
 |
 |
| Trumpet |
White Noise (Shhhh) |
|
|
|
A tongue click |
Background & Techniques
Windows has defined data structures and functions which let programs
access the output of the analog-to-digital converter (ADC) on sound cards, or
other cards that provide appropriate driver software. This
program uses this "Wavein" Application Program Interface (API) to display
recorder input on your monitor. There's not much practical use
for the program except as a test bed for further development.
Kids however do love to "see" their voices and the
waveforms of other weird sounds they can think of. Anything
that motivates them to learn more about the mysteries of the real world must
be a good thing.
Selecting input: To get some input for your oscilloscope, you'll need to adjust the
"Sound Recording" audio properties of your sound card.
Specifics vary from version to version of Windows, but in general you can
right click on the speaker icon on your task bar and select Volume
Controls. From the Volume Controls panel, click Options
then Properties to bring up the dialog that will allow you to select devices and volume levels for
program inputs. You can also get there from your Control Panel by
selecting Sounds & Multimedia then Audio then Recording
Volume. The microphone input is best for playing around, but
you can also use "Wave devices" as input to view sounds that are
being played, for example, via the Windows Media Player. In fact,
Media Player's visualization called "Scope" was my model for the
display.
There's a "Save Image" button that allows you to save up
to 10 screen snapshots with names OScope0.bmp through OScope9.bmp.
As always, if you have any problems or questions, let me know.
Non-programmers are welcome to read on, but may want
to skip to the bottom of this page to download an
executable version of the program.
Notes for Programmers
The prototype input class for my TWaveIn class was a TWaveRecorder
class written by John Mertus of Brown University. A Google search on
"John Mertus" reveals that John may be more famous for earthworms and some
letters he wrote to Dave Barry than TWaveRecorder, but search on TWaveRecorder
and you'll find the article pertinent to this project.
I cleaned up a few things, eliminated some stuff that I didn't
understand, and made a fairly major change in the way that full buffers
are handled. Using the Windows Wavein API requires a multi-step
protocol.
To start input -
 | Allocate the buffers and other data structures used by Wavein API |
| Find a suitable input device. TWaveIn makes sure that there
is a device and the just uses the WAVE_MAPPER parameter at open time which
just means "use the most suitable device you find". |
| Open the device |
| "Prepare" the buffers. |
| Add one or more buffers to the device |
| Start recording, finally! |
When a buffer is full -
| Process the buffer |
| Add the buffer back to Wavein so can be reused. |
And, at close time -
| "Reset" Wavein, telling the driver to stop
collecting data and don't send me any more buffers. |
| Close the device. |
The Callback problem: The WaveInOpen API function lets callers specify what actions to
take when a buffer is full, or otherwise need processing. The CALLBACK_FUNCTION
option caused problems (program hangs) for me when the buffers were reset by
calling WaveInReset. A Google groups search turned up enough other users with
the same problem to convince me to switch to the CALLBACK_WINDOW
technique. (The callback function problems by the way, were variously attributed to
Windows versions or driver versions.) Now, instead of calling the
specified procedure when a buffer is full, the API issues a an MM_WIM_DATA
message. The procedure to be called must be defined as a message
handler for this message. A callback procedure would be
cleaner from the TWavein user's viewpoint, but we can't always get
exactly what we want.
On the main form, most of the code was for handling my experiments in
processing the data. I added Gain and Sweep
controls. Gain multiplies data by 2(gain-3)
, i.e. multiplies or divides data points by 2, 4, or 8, just as a quick way
to provide some vertical scaling. (Multiplication or division is
handled by shift left (shl) or shift right (shr) operations which
shifts data bit by bit. Each bit position shifted multiplies
or divides the value by 2. Sweep gives some horizontal scaling by
incrementing the X-axis by Sweep pixels for each point plotted.
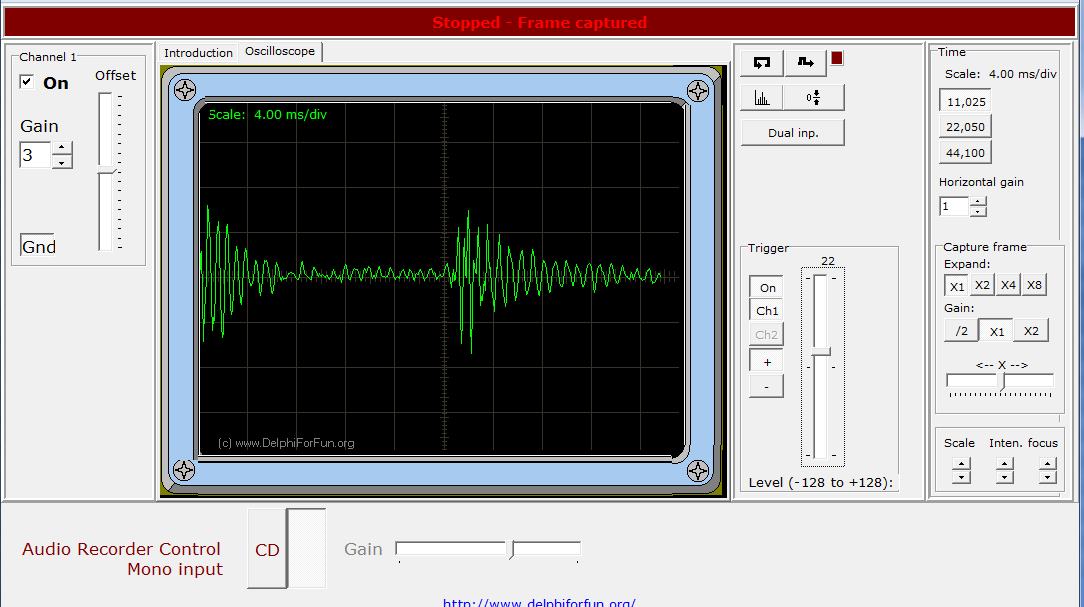
Addendum November 16, 2003: I had occasion to
actually use the Oscilloscope program recently which led to Version 2,
posted today. There are three enhancements:
| A "Trigger" capability has been added. Each scan is triggered when the signal rises above (+) or below (-) the preset trigger
level. |
| To improve the image capture of transient events, there is now a "Capture Single Frame" button. Use the "Trigger" feature to
control when the frame will be captured. |
| A "Set Zero Level" button will center the display vertically
on the screen. One of my sound cards has a "DC
offset" large enough to noticeably move the display
downward. |
Addendum December 5, 2004:
Here is the next cool enhancement
to our evolving Oscilloscope - Version 3 now also functions as a
Spectrum Analyzer!. Click the "Spectrum" button after a
frame has been captured and see the amplitudes of the frequencies contained
in the sample. Fast Fourier Transform (FFT) code has been added to
analyze the signal. Results are displayed in a spectrum bar
graph.
Captured data in both the time and frequencies domains can be saved to a
file for further analysis. Also added user control of standard
sampling rates (11,025 or 22,050 or 44,100 samples per
second).
A buddy of mine is creating the next Stradivarius violin and needed the
resonant frequencies of the instrument when he administers the the
"thump test". So here you go, Jim. I also
added time scale lines to the oscilloscope display and fixed a few other
problems along the way. If there are any bugs left, let me
know.
I'll publish a more extensive sample and write-up of the FFT process one
of these days.
Addendum February 28, 2006:
Version 4 posted today adds a dual trace function using
stereo input signals. The visual layout has been
improved to appear more "osclloscope-like".
Input signals for recordable devices are selectable via
buttons and settings are saved from run to run. Many thanks to "Krille", a very sharp Delphi programmer from
Sweden for doing most of the work on these changes. .
 Addendum February 26, 2007: It has been a year since the
last update. Version 4.2.2 was posted today correcting an error the
spectrum analyzer which showed extra overtones that weren't really
there. I saw it as a 3rd overtone, Angus G. who reported the error
thinks it was the 7th. In any event, I located the bug and fixed it
today. Addendum February 26, 2007: It has been a year since the
last update. Version 4.2.2 was posted today correcting an error the
spectrum analyzer which showed extra overtones that weren't really
there. I saw it as a 3rd overtone, Angus G. who reported the error
thinks it was the 7th. In any event, I located the bug and fixed it
today.
March 29, 2014:
Version 4.2.3 was implemented to correct the
oscilloscope not running after Dual Trace" mode was set without a stereo
formatted input source. Some formatting enhancements were also
made. There are lots of controls on the scope and it is still a work
in progress, so feedback and bug reports are welcome.
April 28, 2014: Some changes were made in Version 4.2.3 today to
improve diagnostics when the input device could not be started for display.
Problem seems to occur when sampling rate is modified in dual display mode.
The suggested solution is to set the sampling rate first, then then turn
on dual display mode. If dual display is chosen for a monaural sound
format, display will contain two nearly duplicate displays since the program
splits each pair of sample points between channel 1 and channel 2.
Running/Exploring the Program
Suggestions for Further Explorations
Lots---
 |
(12/01/04
- time scale lines added to scope display) Scaling
information - . Since we know the sampling rate,
horizontal scaling should be a snap. Vertical scaling is more
problematic. Standard wave files are available which could provide
calibration data in "decibels", a measure of sound
amplitude. Maybe some possibilities there. |
|
There must
be an easy way to record my heartbeat - do-it-yourself EKGs! |
|
Done!
(11/16/03) A real
oscilloscope has a "trigger" control that controls when the
trace starts. Triggers can be positive or negative and
have an associated trigger level control. The effect is to
synchronize multiple traces to reduce "jumping" of the image
especially when there is a predominant frequency in the
signal. It shouldn't be too hard to simulate this feature
in our Oscilloscope program by requiring that the first plotted point
of each trace be the first point after a zero crossing (up or down)
that exceeds a given trigger level value. |
|
Done.
12/05/04 A Spectrum
Analyzer! Even without amplitude calibration, we could determine exact
frequencies and relative power of each. And there are lots more Fast
Fourier Transform routines floating around than the world really
needs. (Fast Fourier Transform is a quick way to move data from the
"time domain", x axis is time, to
the "frequency domain" , x-
axis is "cycles per second", "beats per minute",
etc. ) |
|
Partial
12/05/04 If you're
brave, give the user control over sampling rate and bits per sample.
|
|
I had
planned to implement some timing to calculate percent of total time spent
processing buffers, but ran out of time. Accumulating QueryPerformanceCounter
values at entry and exit to the buffer processing procedure and reporting
as a percentage used every second shouldn't be too
difficult. |
|
I would
be nice to have a "intermittent recorder", say for a
police band scanner. Such a recorder would only save real data
to disk, ignoring the silence between
transmissions. |
|
For extra
credit - teach your computer to understand speech. You now have
access to the same data that the commercial speech recognition programs
have - the rest is just code :>) |
| Original Date: August 14, 2002 |
Modified:
May 15, 2018
|
|
|