[Home] [Puzzles & Projects] [Delphi Techniques] [Math topics] [Library] [Utilities]
|
[Home] [Puzzles & Projects] [Delphi Techniques] [Math topics] [Library] [Utilities]
|
|
Problem DescriptionHere's a function graphing program I wrote in October, 2000. It plots one or two expressions on a common set of X-Y axes. It handles most arithmetic, trigonometric, log and power function expressions and can print the resulting plots. It also plots parametric expressions, for example
x=sin(t); y=cos(t), for t = 0 to 360 degrees generates a circle with radius of
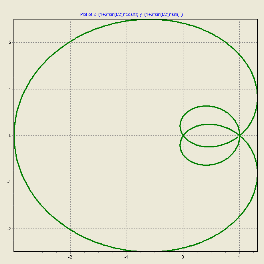
1. Or for Freeth's Nephroid shown at right: x=(1+2*sin(T/2))*cos(T);
y=(1+2*sin(T/2))*sin(T) Background & TechniquesThe program uses the TChart component that is included with Delphi Pro or Enterprise editions to draw the charts. It also uses a freeware TExParser component to parse and evaluate the expressions. This component was last modified and published by Stefan Hoffmeister. Details of credits are included in comments section of Parser10.pas I have modified it slightly to include arcsin and arccos functions and commented out the code that registers it as a component. The Register procedure tells Delphi which tab of the Components panel to place a component on when you install it. I'm not sure if it does anything if you simply compile the component into your program as we do here. I also modified the name from the original TParser to TExParser since a TParser already exists in my version of Delphi (D5 Pro). I'm also not sure what Borland's TParser does, but it doesn't parse and evaluate expressions. Those components do most of the work for us. We need to create the visual framework to handle getting the expressions, loading and saving expressions, calling the print setup dialog and the print routines when requested, etc. The most complicated code that I wrote was to find the parametric variable, if one is used and the code to insert a multiplier of pi/180 inside of trig functions if the user checked a "Angles in degrees " checkbox in the expression definition dialog. This is required because all trig functions in Delphi (and every other language that I'm familiar with) expect angles to be in radians. Addendum: December 5, 2002: Version 1.1 was posted today. In addition to a couple of bug fixes, there are now Help pages describing the rules for defining the expressions to be graphed and some chart navigation features. Charts can be zoomed and point values displayed using the mouse. June 17, 2004: Version 1.2 adds smarter defaults for 2nd series and the ability to manually set the scale for the dependent variable (the vertical scale). Also adds Fermat's Spiral and 8-petal rose charts to samples. March 1, 2007: Version 1.3, SciGrapher13, was posted today. It fixes a number of minor problems with equation and expression formats. (For example, embedded spaces within an expression formerly caused syntax errors. Ok now.) A new feature allows the use of named constants in the expressions defining X and Y. New included sample graphs LemiconOfPascal,grf and St,LouisArch,grf, (an inverted catenary curve), both contain examples of named constant usage, Running/Exploring the Program
Suggestions for Further Explorations
|
[Feedback] [Newsletters (subscribe/view)] [About me]Copyright © 2000-2018, Gary Darby All rights reserved. |