Problem Description
Find the best fit linear least squares line for a given set of
points defined by (X, Y) coordinates..
Background & Techniques
|
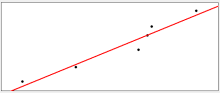 |
X, Y Data
1.1, 2.1
2.3, 3.9
3.7, 6.1
3.9, 7.9
4.0, 9.0
5.0, 11.0 |
|
Best Fit Line is
Y=2.3X-1.0,
R2=0.9384 |
The "least squares line" is the unique line which minimizes
the sum of squares of the differences between the Y value for each X point
and the Y value for the line at that X. Whew! Is is harder to define
the line in words than it is to calculate it!
A straight line is defined by parameters "slope" , M, and
"intercept", B with the equation y = Mx + B where M
indicates how much Y changes for each unit change in X. The
intercept B is the
point where the line intercepts the Y axis. Least Squares is
popular because it also allows measurement of the goodness of fit. The
Correlation Coefficient, R, is one such measure. Specifically R2
has a value that ranges from zero to one, and is the fraction of the
variance in the two variables that is shared. It serves as a
measure of the likelihood that one of X or Y is dependent on the other , (or
they are both dependent on some 3rd unmeasured independent variable.
The demo program allows users to enter an arbitrary set of data points
and calculates the M, B, and R Squared values, The input data
point and the best fit line are drawn.
Notes for programmers
When a viewer asked how to do it the other day, I was mildly surprised to
find that I had never posted a demo about linear regression.
The function LinearLeastSquares resolves that using equations
published in many places on the web. I will include in our Mathslib
unit for the next library update.
I also finally created two other functions which deserve to be in our
library namely, ScaleDataForPlot and ScalePoint.
ScaleDataForPlot takes an array of TRealpoint records along
with the size of the image canvas to draw on and returns an array of
TPoint integer values have been scaled to cover the range from 10% to
90% o the X and Y ranges. Y values are also inverted to account for
the computer's insistence that Y increases from top to bottom.
It also returns X and Y offset and scaling information in a record which can
be passed to the ScalePoint function to scale individual points.
(For example, the end points of the regression line to be drawn in the
current program.)
The final function which could be expanded to be a useful library tool is
the GetNextNumber function which scans the input lines after the user
enters data to validate and convert strings to real values. It handles
a few of the errors which users can make but is still a little fragile and
could use more work.
All in all, a potentially useful exercise if I just get around to
updating the library making these new functions available for easy access.
Running/Exploring the Program